Understanding Your Blood Pressure Chart: A Complete Guide
Learn how to read a blood pressure chart, understand systolic and diastolic numbers, and know what your readings mean for your health.
What Is a Blood Pressure Chart?
A blood pressure chart is a simple yet essential tool used by healthcare professionals and individuals to interpret blood pressure readings. It categorizes blood pressure into ranges—from normal to hypertensive crisis—based on systolic and diastolic numbers. Understanding this chart can help you monitor your cardiovascular health and take timely action if your readings fall outside the healthy range.
Understanding Systolic and Diastolic Numbers
Blood pressure is recorded as two numbers: systolic (the top number) and diastolic (the bottom number). The systolic pressure measures the force of blood against artery walls when the heart beats, while diastolic pressure measures the same force between beats when the heart is at rest. Both numbers are crucial for assessing your risk of heart disease, stroke, and other conditions.
Blood Pressure Categories Explained
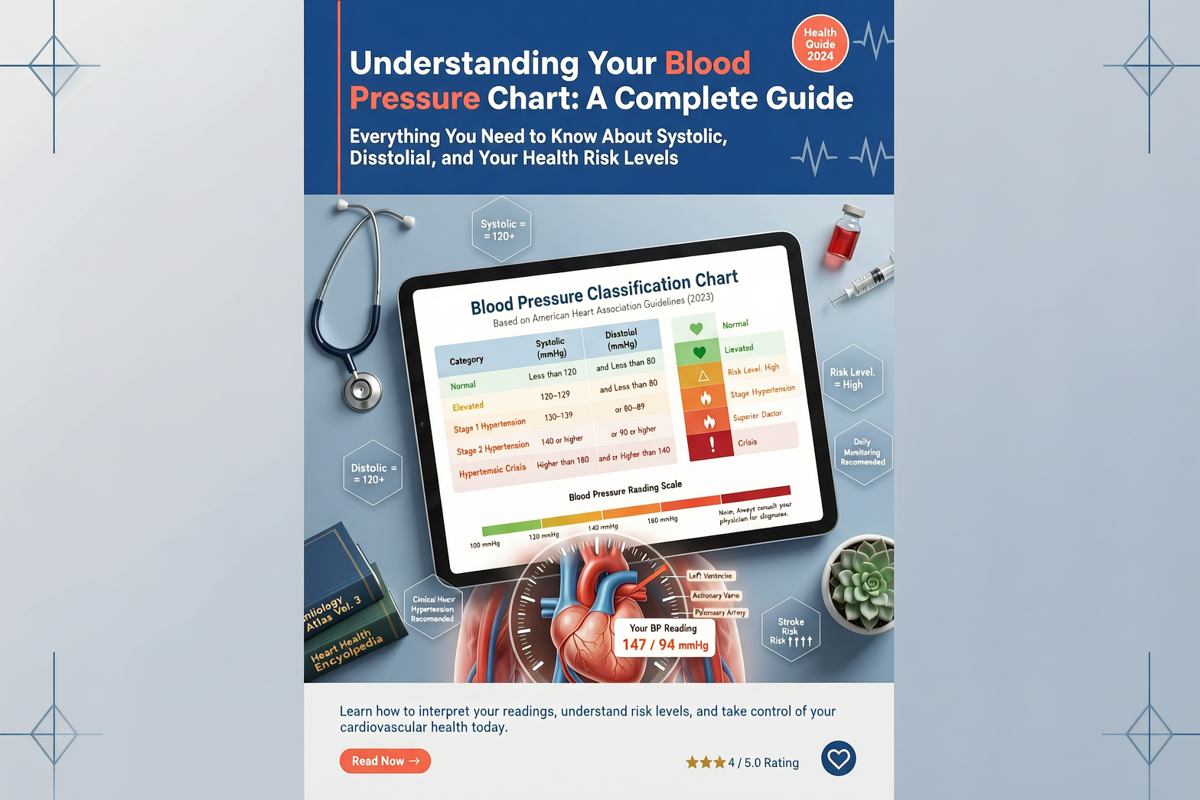
The standard blood pressure chart includes several categories:
- Normal: Systolic less than 120 mmHg and diastolic less than 80 mmHg.
- Elevated: Systolic 120–129 mmHg and diastolic less than 80 mmHg.
- High Blood Pressure Stage 1: Systolic 130–139 mmHg or diastolic 80–89 mmHg.
- High Blood Pressure Stage 2: Systolic 140 mmHg or higher or diastolic 90 mmHg or higher.
- Hypertensive Crisis: Systolic over 180 mmHg and/or diastolic over 120 mmHg. This requires immediate medical attention.
It's important to note that a single high reading does not necessarily mean you have hypertension. Your doctor will consider multiple readings over time to make a diagnosis.
How to Use a Blood Pressure Chart
To use the chart, find your systolic number on the left and your diastolic number on the top. The intersection indicates your blood pressure category. For example, if your systolic is 132 and diastolic is 85, you fall into Stage 1 hypertension. Many charts also include color coding (green, yellow, orange, red) for quick visual reference.
Factors That Affect Blood Pressure Readings
Several factors can cause temporary fluctuations in blood pressure, including stress, caffeine, exercise, and even the time of day. For accurate readings, follow these tips:
- Rest for at least 5 minutes before measuring.
- Avoid smoking, caffeine, and exercise for 30 minutes prior.
- Use a properly sized cuff and keep your arm at heart level.
- Take multiple readings and average them.
Why Monitoring Your Blood Pressure Matters
High blood pressure often has no symptoms, which is why it's called the "silent killer." Regular monitoring can help you detect changes early and prevent complications such as heart attack, stroke, kidney damage, and vision loss. A blood pressure chart empowers you to take control of your health by providing a clear picture of where you stand.
When to See a Doctor
If your readings consistently fall into the elevated or high blood pressure categories, consult your healthcare provider. They can recommend lifestyle changes—such as a heart-healthy diet, regular exercise, and stress management—or prescribe medication if needed. In case of a hypertensive crisis (180/120 mmHg or higher), seek emergency care immediately.
Tips for Maintaining Healthy Blood Pressure
- Eat a balanced diet: Reduce sodium intake and eat plenty of fruits, vegetables, and whole grains.
- Stay active: Aim for at least 150 minutes of moderate exercise per week.
- Maintain a healthy weight: Excess weight can increase blood pressure.
- Limit alcohol and avoid tobacco: Both can raise blood pressure.
- Manage stress: Practice relaxation techniques like deep breathing or meditation.
Conclusion
A blood pressure chart is a valuable tool for understanding your cardiovascular health. By learning how to read it and monitoring your numbers regularly, you can take proactive steps to maintain healthy blood pressure and reduce your risk of serious health issues. Always consult your doctor for personalized advice and treatment.